P1: Internet Map
A plan to create one of the world’s largest datacenters, a gargantuan project spanning an area more than twice the size of Manhattan, has provoked a furious public backlash in Utah amid concerns over its vast energy use and impact upon the state’s stressed water supplies.
The Stratos artificial intelligence datacenter footprint will cover more than 40,000 acres (62 sq miles) over three sites in Box Elder county in north-western Utah. The facility will require about 9GW of power, which is more than the entire state of Utah currently consumes, and suck up a significant amount of water in an area that has been hit by severe drought in recent years.
– ‘Irresponsible’: backlash as Utah approves datacenter twice the size of Manhattan, Oliver Milman
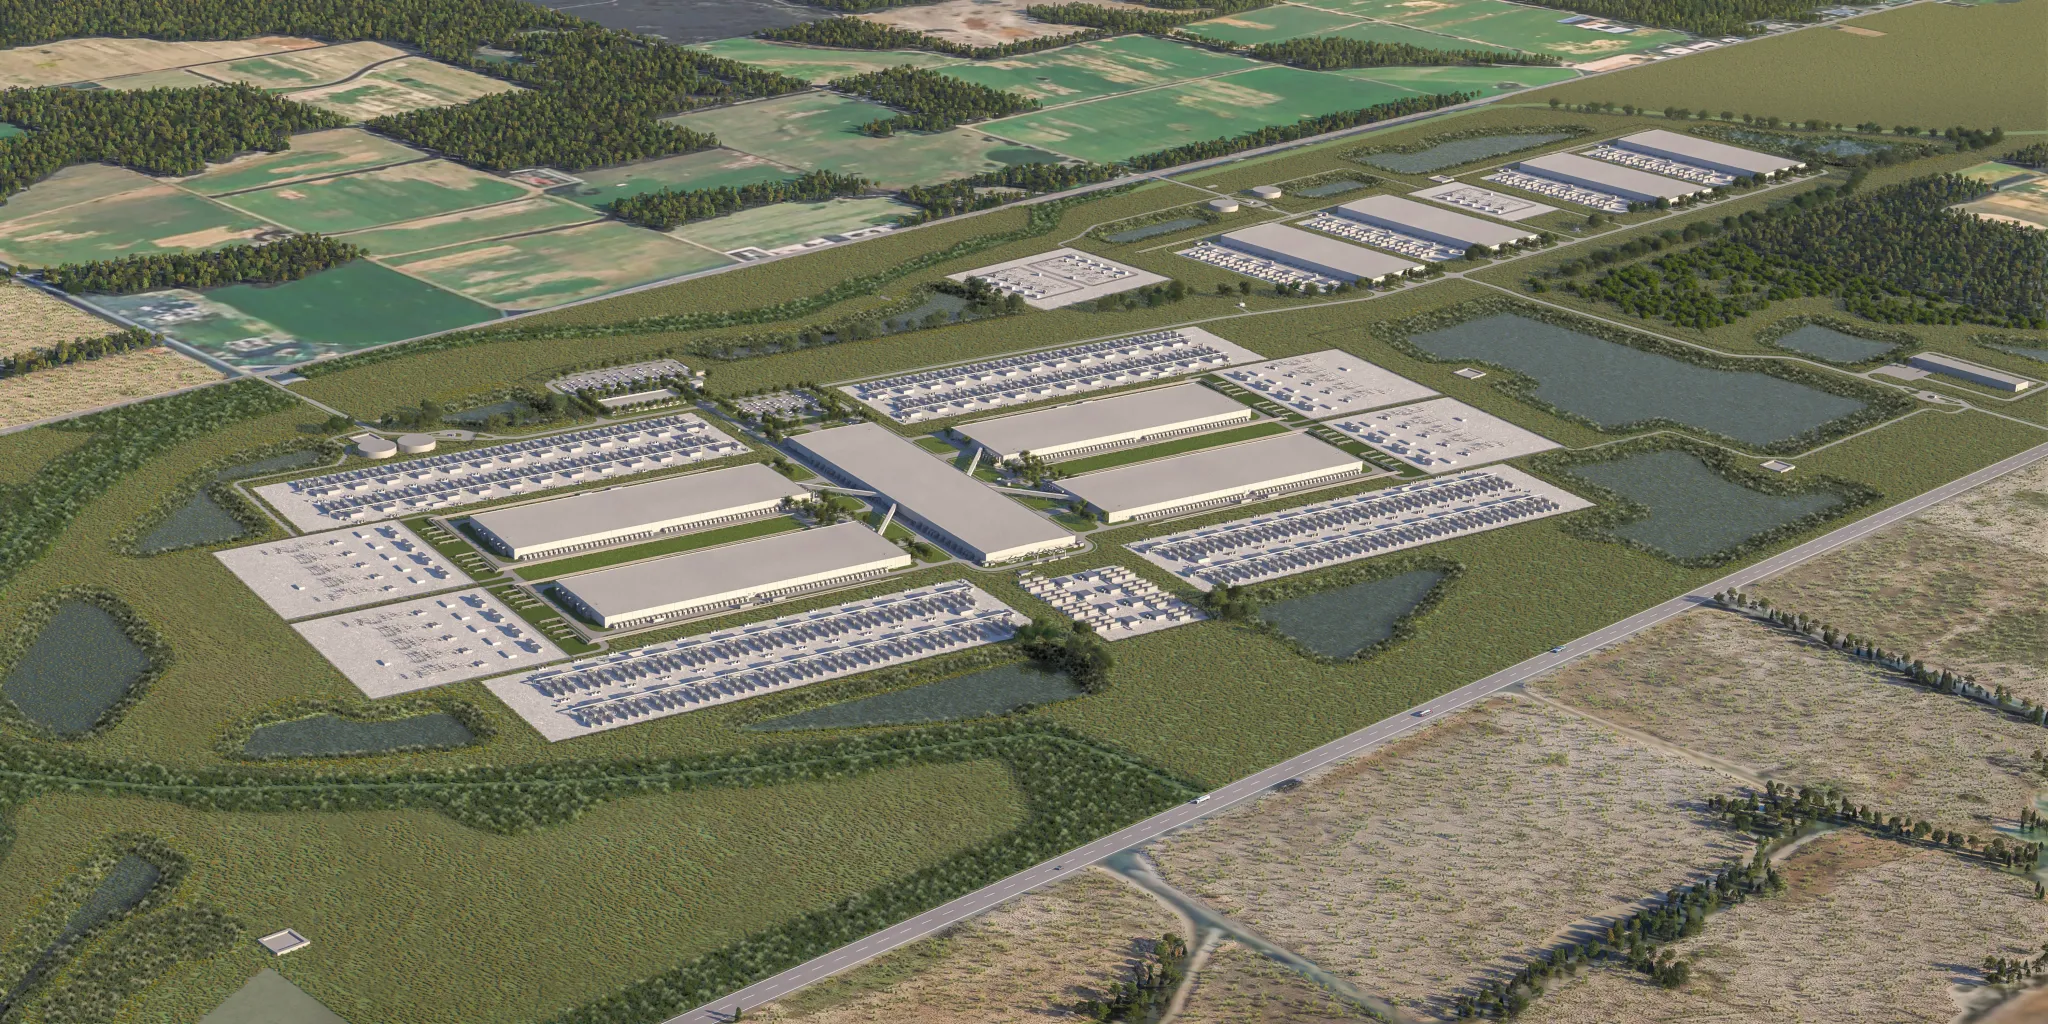
Meta data center in Richland Parish, Louisiana
The shape of the internet is difficult to define because our entry points often feel immaterial. While we access vast amounts of information, our devices are compact and feel disproportionately small compared to their capabilities. However, the internet is fundamentally physical. It relies on data centers, transoceanic cables, satellites, and extensive infrastructure. Massive mining and assembly projects are required to produce the devices we use to browse the web daily.

iPhone Air
When visiting a single web page, information may be loaded from sources around the world. For instance, consider a social media post: while the content may appear centralized, the geographic location where it was authored adds another layer to its map. Similarly, when streaming a video game, the rendering of graphics often happens remotely before being delivered back to your device.

Captives of the Cloud, Metahaven
On our phones, AI features are increasingly integrated regardless of our willingness to adopt them. How do we measure the physical footprint of these features? When assessing their presence, we must consider the intense “compute” power required to train these models as part of their physical footprint.

Whether this physical infrastructure is purposefully hidden is arguable, but it is clear that the full scope of the internet's physicality remains misunderstood by most. Of course, a map does not need to represent only physical space; it can also describe relationships, concepts, and systems. Furthermore, how the internet “maps you” is of equal concern.

Dive Expedition to Look at Undersea Cables, Trevor Paglen
In this assignment, we will each define a section of the internet to “map” and create an original project based on that definition. Precise technical accuracy is not the primary goal; while detail is informative, I encourage you to center your unique point of view. For example, rather than simply explaining the technical infrastructure of a recommendation algorithm, you might create a map that reveals something subjective about the algorithm's influence.
Furthermore, take this as an opportunity to experiment with mapping practices. While a drone allows for precision, consider how a low-flying "satellite" made from a balloon might capture an image. Can you create maps in unorthodox ways, perhaps through cyanotypes? These maps are intended to set the groundwork for a response you will complete in the second half of the semester.
Due: Apr 30, May 14, May 28
Learning Outcomes
- Expanded understanding of the internet's physical infrastructure
- Insights into networked technologies
- Infographic and mapping experience
- Developing a point of view about communication platforms
Requirements
- 7 minute presentation on research topic
- A "map" of some section of the internet
Schedule
Week 1 – Sept 3
No Class

Week 2 – Sept 10
Project kickoff

Week 3 – Sept 17
Visit Arko Museum of Art

Week 4 – Sep 24
Chuseok Holiday

Week 5 – Oct 1
Share map proposals

Week 6 – Oct 8
Map sketches

Week 7 – Oct 15
Near final Maps

Week 8 – Oct 22
P1 Due
Reading
- Anatomy of an AI System by Kate Crawford and Vladan Joler
References
- Undersea Cables by Trevor Paglen
- Landing Sites
- Dive Expedition to Look at Undersea Cables
- Forensic Architectue
- No Distance: On Technical Complicity and Regenerative Technologies by Federico Pérez Villoro, Web design and development by Tiger Dingsun
- Internet Walking Tours by Anne Lee Steele
- walking the internet by Laurel Schwulst
- (moth) in Relay by Shaheer Tarar
- Spiral Getty by Shaheer Tarar
- Jainamaaz: Prayer Place by Omar Mohammad
- Summer by Olia Lialina